"
Mindset Over Method Evidence Base

The evidence behind the course.

Every claim in Mindset Over Method is grounded in published research. This page collects the data in one place — organised by theme, with sources — so you can verify it yourself or forward it to whoever needs to approve the investment.

Send this to your manager

This page is designed to be shared. If you need to build an internal case for this investment, start here. The data quantifies the problems the course addresses. The sources are linked. The cost of inaction is specific enough to put in a business case.

Without data, you’re just another person with an opinion

— W. Edwards Deming
Theme 01
01
Maps to Lessons 1, 4, 13

Corporate decline is accelerating

The average lifespan of an S&P 500 company has been halved in 60 years — and is still shrinking. This is not a technology problem. It is a thinking problem: the organisations being replaced are the ones that stopped questioning the assumptions on which they were built.

33 years (1965) → 21 years (2020) → projected ≤15 years (late 2020s)
Why it mattersThe market is punishing institutional rigidity at an increasing rate. The window for course-correction is shrinking with every cycle.
Approximately half of the current S&P 500 will be replaced within the next decade at current churn rates
Innosight · 2016, updated 2021
Why it mattersThis is not a distant trend. It is happening to incumbents now — companies with the resources, the talent, and the market position to survive, if they could think differently.
20% of S&P 500 constituents turn over every five years — a pattern consistent since 1985
Goldman Sachs Research (Ben Snider); corroborated by Apollo Academy · January 2026
Why it mattersThe churn rate is structural, not cyclical. It persists across booms, recessions, and technology shifts — which means the cause is upstream of any single market condition.
Theme 02
02
Maps to Lessons 1, 10, 11, 12

The engagement crisis

The global engagement data is not ambiguous. The majority of the workforce is psychologically absent — and the cost is measurable in productivity, turnover, and wellbeing. The root cause is not motivation. It is leadership.

US$438B
in lost productivity · one year
The decline in global employee engagement from 23% to 21% in 2024 — the sharpest drop since the pandemic — cost the global economy an estimated US$438 billion in lost productivity in a single year.Gallup, State of the Global Workplace Report 2025
Global employee engagement fell from 23% to 21% in 2024 — the sharpest drop since the pandemic
Gallup, State of the Global Workplace Report 2025 (263,810 respondents, 160+ countries) · 2025
Why it mattersThe scale and recency of this decline make it the single most damning data point on organisational leadership available today.
If every organisation reached best-practice engagement (~70%), the world economy could grow by an additional US$9.6 trillion — a 9% boost in global GDP
Gallup, State of the Global Workplace Report 2025 · 2025
Why it mattersThe gap between current performance and best practice is not marginal. It is transformational — and it is entirely a leadership variable.
Manager engagement fell from 30% to 27% globally; managers under 35 dropped 5 points; female managers fell 7 points
Gallup, State of the Global Workplace Report 2025 · 2025
Why it mattersDisengagement cascades. When managers disengage, teams follow. The problem is not at the edges of the organisation — it is at the centre.
In best-practice organisations, 75% of managers and 70% of employees report being engaged — vs the global average of 21%
Gallup, State of the Global Workplace Report 2025 · 2024
Why it mattersThe gap between the best and the rest proves this is a design problem, not an intractable human condition. Some organisations have solved it. Most have not.
Highly engaged organisations see 51% lower turnover, 23% higher productivity, and 68% better employee wellbeing
Gallup meta-analysis · 2024
Why it mattersThe return on getting engagement right is not theoretical. It is measured across hundreds of organisations and millions of employees.
Theme 03
03
Maps to Lessons 1, 2, 6, 11

Leadership development is broken

Organisations spend more on leadership training than ever before. The outcomes have not improved. The failure is not in the delivery — it is in the design. Most programmes target behaviour without addressing the thinking that drives it.

US$366B
Invested annually
Global spending on leadership training and development. US companies alone account for over US$160 billion.
70%
Failure rate
Of leadership development programmes fail to change leaders' behaviours — the entire point of the exercise.
Only 10% of leadership training delivers meaningful results; 75% of organisations rate their own programmes as "not very effective"
Why it mattersThe industry's own self-assessment confirms the failure. Three-quarters of organisations buying leadership development know it is not working.
Only 11% of executives surveyed by McKinsey strongly agreed that their leadership development efforts achieved desired outcomes
McKinsey & Company · 2014
Why it mattersEven the buyers acknowledge the programmes are not delivering. The problem is not awareness — it is design.
Adults retain just 10% of what they hear in classroom lectures, versus nearly two-thirds when they learn by doing
Why it mattersThe dominant delivery format for leadership training contradicts what we know about how adults actually learn.
McKinsey's four common failures in leadership development
McKinsey & Company · 2014
  1. No appreciation for context
  2. No emphasis on action
  3. No attention to assumptions
  4. No clarity about outcomes
Why it mattersMindset Over Method was designed to address all four. The course exists because these failures persist.
Theme 04
04
Maps to Lessons 1, 4, 10, 11

Psychological safety predicts team performance

The research is settled: the single strongest predictor of team effectiveness is not talent, seniority, or composition. It is whether people feel safe enough to think out loud, challenge ideas, and surface problems without punishment.

Google's Project Aristotle studied 180 teams across 250+ attributes over two years; psychological safety was the single strongest predictor of team effectiveness
Google re:Work; Duhigg, New York Times Magazine · 2014/2016
Why it mattersThe most widely cited study on team performance points to a leadership variable, not a talent one. You cannot recruit your way out of a safety deficit.
Teams with high psychological safety saw 32% faster project completion after implementing trust-building strategies
Aristotle Performance analysis
Why it mattersThe principle converts directly into operational speed. Safety is not a soft variable — it is a throughput multiplier.
Amy Edmondson's research confirms psychological safety predicts team performance, software delivery, organisational performance, and productivity across industries
Why it mattersThis is not a tech-sector phenomenon. The evidence holds across industries, geographies, and team structures.
Only 26% of workers felt psychologically safe during and after the pandemic shift to remote work
Workhuman (cited in Research-Technology Management) · 2023
Why it mattersThe deficit is current and widespread. Three-quarters of the workforce do not feel safe enough to do their best thinking at work.
Theme 05
05
Maps to Lessons 3, 5, 8, 9, 14

Cognitive biases are an organisational cost centre

Cognitive biases are not individual quirks. They are systematic errors with quantifiable financial consequences — and they compound across hierarchies, time frames, and decision cycles. The organisations that manage them structurally outperform those that rely on personal vigilance.

Confirmation bias has a 50% chance of leading decision-makers to select options that reinforce pre-existing beliefs while ignoring superior alternatives
Why it mattersThe most common bias in leadership decision-making is also the most dangerous. Half the time, the leader's prior belief is selecting the answer before the analysis begins.
40% of businesses are affected by the sunk cost fallacy — continuing to invest in failing projects because of prior investment
Yeung, Semantic Scholar review
Why it mattersThis is why organisations persist with strategies that have stopped working. The past investment becomes the justification for future waste.
High-quality debate in big-bet decisions led to outcomes that were 2.3× more likely to be successful
Why it mattersStructured challenge — the deliberate antidote to unchecked bias — more than doubles the probability of a good outcome.
Organisational spending allocations were correlated by more than 90% from year to year — evidence of inertia bias preventing strategic reallocation
McKinsey, "Biases in Decision-Making: A Guide for CFOs" · 2025
Why it mattersMost organisations are not making fresh decisions. They are inheriting old ones. The budget you approved last year is almost certainly the budget you will approve next year — regardless of whether the strategy still warrants it.
The course examines how these biases compound at organisational scale through case studies including Theranos, Boeing, Kodak, the 2008 financial crisis, and Quibi's $2 billion failure — each illustrating a different mechanism by which individual cognitive shortcuts become institutional vulnerabilities.
Theme 06
06
Maps to Lessons 1, 12, 16

The productivity paradox

For four decades, the same pattern has repeated: a transformative technology arrives, organisations invest heavily, and productivity growth fails to materialise. The pattern is now repeating with AI. The bottleneck has never been the tool. It has always been the thinking that directs its use.

"You can see the computer age everywhere but in the productivity statistics."
Robert Solow · Nobel laureate · New York Times Book Review · 1987
Historical · 1987–1993
US computing capacity increased a hundredfold in the 1970s–80s, yet labour productivity growth slowed from over 3% (1960s) to roughly 1% (1980s)
Why it mattersThe paradox is not new. It has been the default outcome of every technology wave. More capability does not automatically produce better results.
Before IT, expected return on technology investment was 3–4%; with IT, actual return was only 1% from the 1970s to early 1990s
Stanford CS research summary
Why it mattersThe gap between expected and actual technology returns has persisted for decades. The assumption that better tools produce better outcomes is contradicted by the data.
AI era · 2024–2026 · The pattern repeats
374 S&P 500 companies mentioned AI in earnings calls (2024–25), but positive adoptions are not reflected in broader productivity gains
Fortune synthesis of Financial Times, NBER, and Apollo Economics · 2025–2026
Why it mattersThe paradox is repeating with AI. Adoption is high. Impact is low. The pattern has not changed because the constraint was never the technology.
An NBER study of 6,000 CEOs and executives across the US, UK, Germany, and Australia found the vast majority see little measurable impact from AI on their operations
National Bureau of Economic Research (cited via Fortune) · 2026
Why it mattersThe executives deploying AI are themselves reporting the gap between investment and outcome. This is not a fringe observation — it is the majority view from inside the organisations spending the money.
Apollo chief economist: AI is not showing up in profit margins or earnings expectations outside the largest tech companies
Torsten Slok, Apollo Economics (cited via Fortune) · 2026
Why it mattersAt the broadest economic level, AI has not yet moved the needle. The technology exists. The productivity does not.
The WEF projects that 39% of workers' core skills will change by 2030, yet productivity growth remains near zero
Why it mattersThe skills landscape is shifting faster than ever. The outcomes are not improving. The constraint is upstream of skills — it is in the thinking that directs them.
+13%
AI use by workers · 2025
Regular AI use increased among workers.
−18%
Confidence in AI utility · 2025
Confidence in the technology's utility fell over the same period.
ManpowerGroup, 2026 Global Talent Barometer (14,000 workers, 19 countries · cited via Fortune) · 2026
Theme 07
07
Maps to Lessons 14, 15, 16

94% of problems belong to the system

The instinct to identify an individual when something goes wrong is neurologically predictable and strategically expensive. It produces a narrative, an apparent resolution, and no improvement to the system that permitted the failure.

94%
System
vs
6%
Individual
W. Edwards Deming estimated that 94% of problems and possibilities for improvement belong to the system. Only 6% are attributable to individual workers or special causes.Deming, Out of the Crisis, 2nd Edition, p. 315 · 2000
"The system that people work in and the interaction with people may account for 90 or 95 percent of performance"
Why it mattersThe same principle, restated across decades. Performance is a system output, not an individual one.
The Fundamental Attribution Error — the tendency to blame individuals rather than systems — is one of the most well-documented cognitive biases in social psychology
Social psychology literature (multiple sources) · Ongoing
Why it mattersLeaders default to blame not because they are careless, but because the brain is wired to attribute outcomes to individuals. It is a predictable cognitive shortcut — and it is wrong 94% of the time.
Organisations that shifted from blame-based approaches to systems-based improvement (Lean, Toyota Production System, Just Culture) consistently demonstrated higher quality, lower costs, and better safety outcomes
Lean Systems Institute; To Err Is Human (Institute of Medicine) · 1999 onwards
Why it mattersThe systems approach is not theoretical. It has been tested across manufacturing, healthcare, aviation, and technology — and it outperforms blame in every domain where it has been measured.
Theme 08
08
Maps to Lessons 10, 11

Character-driven leadership delivers 5× returns

The relationship between leadership character and financial performance is not aspirational. It has been measured — across Fortune 500 companies, over seven years, by an independent research team. The results are stark.

9.35%
High-character CEOs · ROA
1.93%
Self-focused CEOs · ROA
CEOs rated high on integrity, responsibility, forgiveness, and compassion delivered an average Return on Assets of 9.35% — versus 1.93% for self-focused CEOs. A five-to-one performance differential.KRW International · Harvard Business Review · 2015
KRW International's seven-year study examined over 80 CEOs and their employees across Fortune 500 companies, privately held firms, and nonprofits
Why it mattersThis is the largest and longest study linking CEO character to financial performance. The sample is broad enough and the timeline long enough to rule out noise.
High-character leadership teams showed 26% higher workforce engagement and notably lower corporate risk
KRW International · 2015
Why it mattersEngagement is the mechanism through which character transmits to financial performance. Character shapes culture; culture shapes engagement; engagement drives results.
Self-focused CEOs were reported by their employees to tell the truth "slightly more than half the time", could not be trusted to keep promises, and frequently punished well-intentioned people for making mistakes
Kiel, Return on Character · 2015
Why it mattersThis is the behavioural profile of low-character leadership. It is not extreme. It is ordinary — and recognisable in most organisations.
Upper Echelons Theory (Hambrick & Mason): an organisation is a reflection of its senior leadership team — leaders' biases become company policy; their fears become organisational silos; their character becomes the culture
Why it mattersThe theoretical framework that explains how character transmits through an organisation. Leadership character is not a personal attribute — it is an organisational variable.
Theme 09
09
Maps to Lessons 4, 12, 13

Short-termism is destroying long-term value

Short-term thinking is not a character flaw. It is a rational response to incentive structures that reward quarterly performance at the expense of long-term value creation. The cost of that design choice has been measured — and it runs into trillions.

US$1.7T
Destroyed over 22 years
The CFA Institute estimated the agency costs of corporate short-termism at US$1.7 trillion over a 22-year period — approximately US$79.1 billion annually. Not lost to market conditions. Lost to chosen incentive structures.CFA Institute, "Short-Termism Revisited" · 2020
80% of CFOs would reduce discretionary spending on value-creating activities (marketing, R&D) to meet short-term earnings targets; nearly 40% would offer customer discounts to pull revenue into the current quarter
Why it mattersShort-termism is not an edge case. It is the default financial management posture. Eight in ten CFOs will sacrifice future value to meet this quarter's number.
Long-term-focused companies saw 47% higher revenue growth and 36% higher earnings growth than short-term peers over 15 years (2001–2015)
Why it mattersThe clearest evidence available that long-term orientation produces superior financial outcomes — not marginally, but substantially.
Long-term companies added nearly 12,000 more jobs on average than short-term peers; if the whole US economy had matched long-term company performance, GDP could have grown by an additional US$1 trillion
McKinsey Global Institute · 2017
Why it mattersThe cost of short-termism extends beyond individual firm performance. It is a macroeconomic drag measured in trillions.
Theme 10 · Central creative concept
10
Maps to Lessons 1, 3, 6, 9

The neuroscience of decision-making

The conscious mind processes roughly 50 bits of information per second. The senses take in millions. The gap between those two numbers is filled by cognitive shortcuts the brain applies automatically and unconsciously. That gap is where biases live, where culture forms, and where your organisation's future is decided — in the half-second before a leader responds.

~50
Bits per second
Processed consciously. Everything you deliberately think about.
11M+
Bits per second
Taken in by the senses. Filtered automatically by heuristics before awareness.
The conscious mind processes roughly 50–60 bits of information per second; the senses take in millions of bits per second; the gap is bridged by automatic cognitive shortcuts (heuristics)
Why it mattersThe scale of unconscious processing explains why awareness alone cannot neutralise bias. The volume of information your brain filters before you become conscious of it dwarfs anything you can monitor deliberately.
Daniel Kahneman's research (Nobel Prize, 2002): human decision-making relies on two systems — System 1 (fast, automatic, emotional) and System 2 (slow, deliberate, logical); most leadership decisions are made by System 1
Why it mattersExperience does not protect leaders from poor decisions. It accelerates them. The more expert the leader, the more they rely on System 1 — and the more vulnerable they are to the biases embedded in it.
A Cambridge study found that spending one additional minute on a problem increases the probability of answering correctly by about one percentage point — but the real driver was "the right way of looking at the problem," not effort
Why it mattersThe quality of the thinking matters more than the quantity of the effort. Working harder on the wrong framing does not produce a better answer. This is the course's central thesis.
Supplementary
+
Maps to all lessons · WEF contextual framing

The skills landscape is shifting

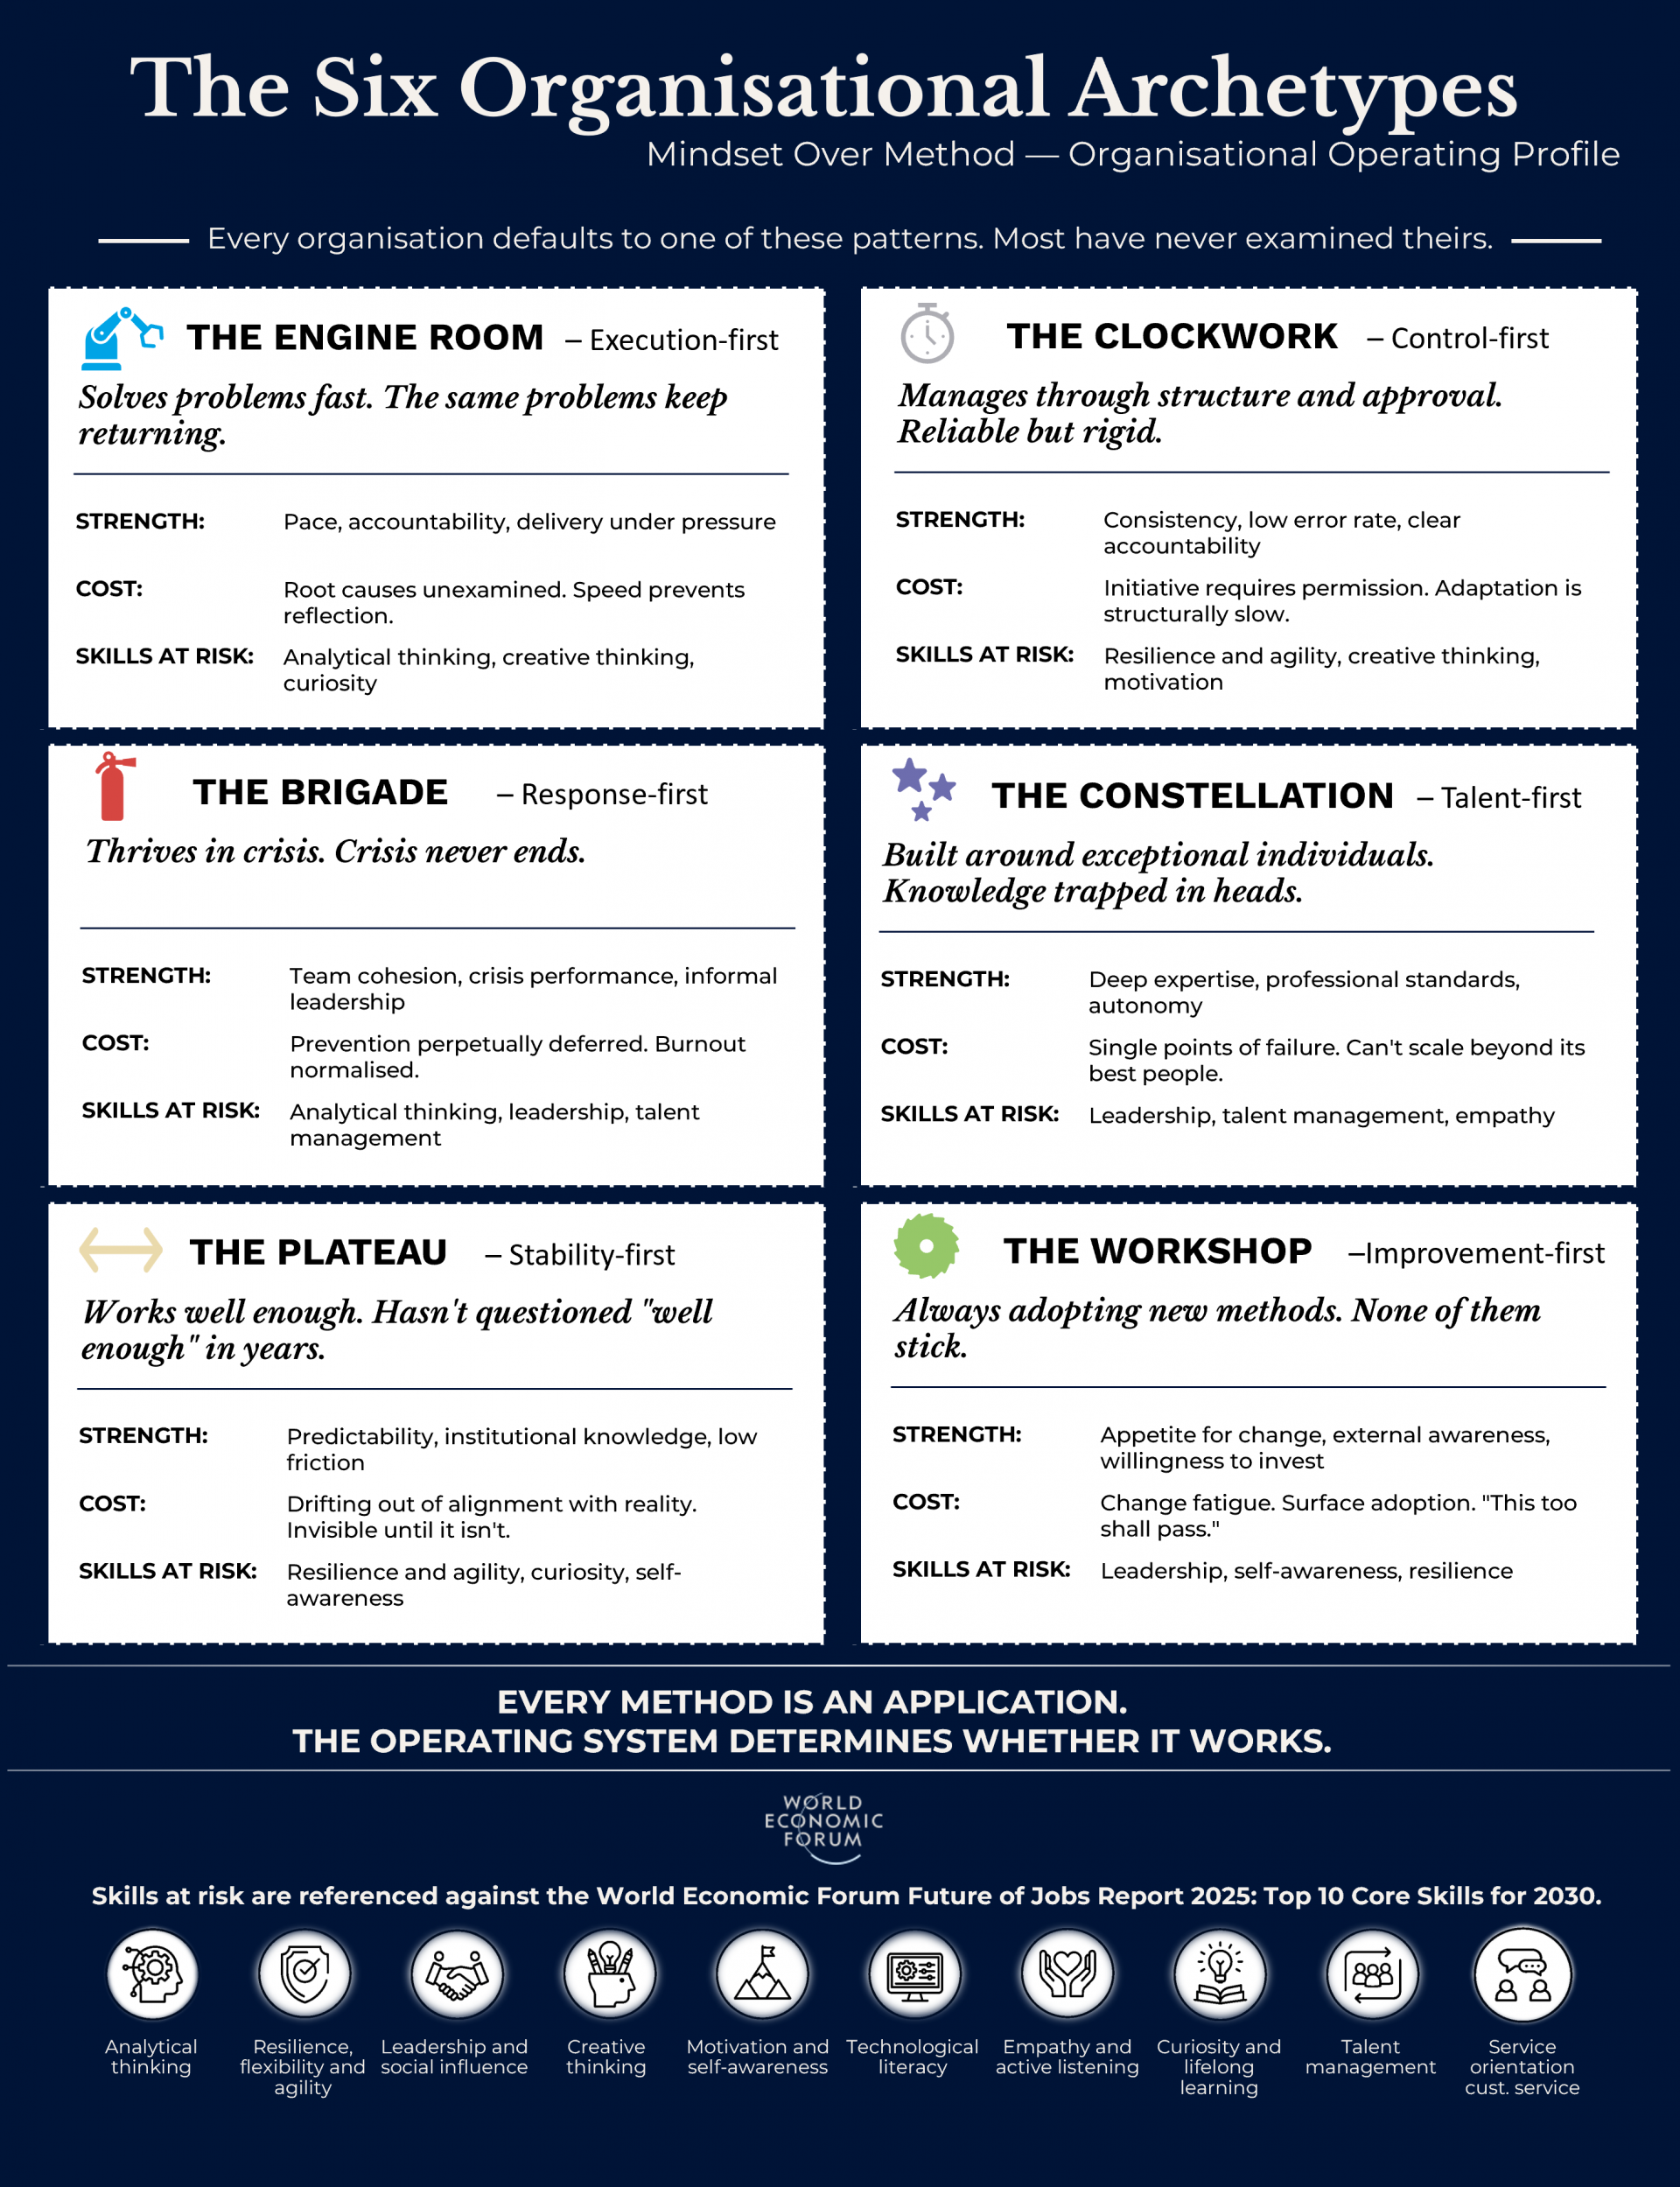
The WEF Future of Jobs Report 2025 provides the external validation for the course's thesis: the skills that will define effective leadership in 2030 are precisely the capabilities this course builds.

Source for all data points below: WEF Future of Jobs Report 2025

39%
Of workers' core skills will change by 2030
The skills landscape is shifting faster than most development programmes can adapt. The question is whether your organisation's leadership thinking is shifting with it.WEF Future of Jobs Report 2025
Analytical thinking ranked as the top core skill by seven in ten employers globally
Why it mattersThe single most in-demand capability is the one most vulnerable to cognitive bias without structural support.
Leadership and social influence is the fastest-rising core skill — up 22 percentage points since 2023
Why it mattersThe market is repricing leadership. The demand is accelerating faster than any other capability — and the existing development infrastructure is failing to meet it.
Curiosity and lifelong learning is a top-ten core skill and one of the fastest growing heading into 2030
Why it mattersThe "curse of competence" — the tendency for expertise to calcify into certainty — is the direct enemy of this skill. The course addresses it in Lesson 2.
Resilience, flexibility, and agility is the single greatest differentiator between growing and declining job roles
Why it mattersThe case for antifragility and systems design over individual heroism. Organisations that depend on resilient individuals are fragile. Organisations that build resilient systems are not.
Systems thinking is identified as one of the human-centric skills solidifying in importance heading into 2030
Why it mattersDirect validation of the course's fourth cornerstone. Systems thinking is not a niche competency — it is a core leadership requirement for the next decade.

The cost of not acting is specific.

The data on this page is not curated to sell a course. It is curated because it quantifies the problems that Mindset Over Method was built to address.

The disengagement costing $438 billion a year. The $366 billion spent on leadership training that does not work. The cognitive biases compounding unchecked across every decision cycle. The systems that reward firefighting over prevention. The short-term incentives that have destroyed $1.7 trillion in long-term value.

These are not abstract risks. They are measurable costs — and they are accumulating in your organisation right now.

A note on sources

All sources on this page were selected against five criteria: authority, accuracy, objectivity, currency, and coverage. Priority was given to:

  • Gallup — largest ongoing global workplace study (5.7M+ respondents since 2009)
  • McKinsey Global Institute — peer-reviewed-equivalent corporate research
  • Harvard Business Review / Harvard Business School — gold standard in management research
  • KRW International / Duke University — seven-year longitudinal CEO study
  • W. Edwards Deming Institute — foundational systems thinking authority
  • Google re:Work — internal study of 180 teams, subsequently validated by external research
  • National Bureau of Economic Research (NBER) — leading US economics research body
  • World Economic Forum — the Future of Jobs Report 2025 informs every lesson's relevance framing
  • CFA Institute — global standard-setter for investment professionals
All URLs verified April 2026

Extraordinary claims require extraordinary evidence

— Carl Sagan
"